




A security awareness manager sits down for the monthly review with two numbers already in hand, the click rate and the training completion rate, and a question from the CISO about what changed since last month. Both numbers are easy to pull and hard to act on. This post is for program owners who need security awareness metrics to run the program on, not only to report upward.
In short: Track reporting rate, time to report, repeat behavior, coverage and time to response, and read each one by role and department. Keep click rate and completion as context. Tie every metric to the action it triggers.
Operational Metrics Versus Board Metrics
Board reporting asks whether human risk is falling and whether the program deserves its budget. The monthly review asks something narrower: which people, in which teams, need something different next month. We cover the first question in Security Awareness KPIs for the Board on One Page, including how to frame security awareness board reporting. This post covers the layer underneath it.
That layer matters because the board page is a summary of it. If the monthly numbers are thin, the summary inherits the weakness. NIST's SP 800-50 Rev. 1 includes suggested metrics and evaluation methods so that organizations can regularly improve and update a learning program, which is the job the monthly review does.
Security Awareness Metrics for the Monthly Review
Completion and click rate describe activity. They show who finished a module and who fell for a lure, but not whether people are getting better at spotting and reporting attacks. Five measures close that gap.
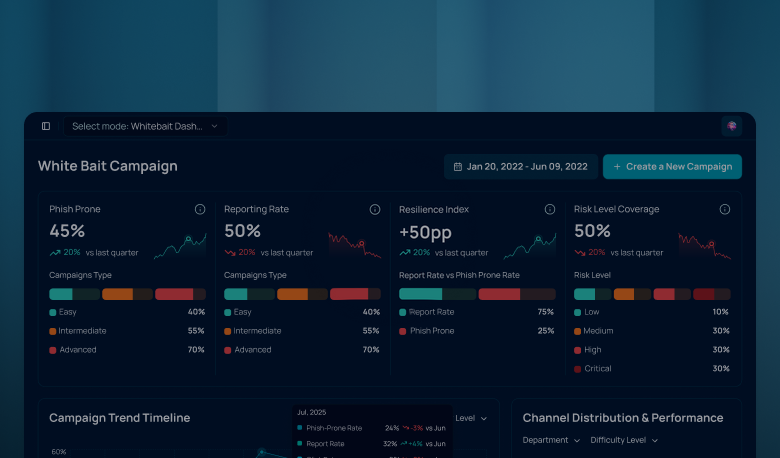
- Reporting rate. The share of people who report a simulated or real suspicious message. Whitebait tracks it next to click rate.
- Time to report. How long passes between delivery and the first report. A shorter time gives the security team a head start.
- Repeat behavior. The share of people who fail again within a set window, counted per person and not per campaign.
- Coverage. The share of people, roles and attack types (credential harvesting, QR codes, MFA bypass) actually exercised in the period.
- Time to response. How long passes between a risky behavior and the coaching that follows it.
Reporting is the one to read first. The Verizon 2024 Data Breach Investigations Report found that in security awareness exercise data from 2023, 20% of users identified and reported phishing in simulation engagements, and 11% of the users who clicked the email also reported it.
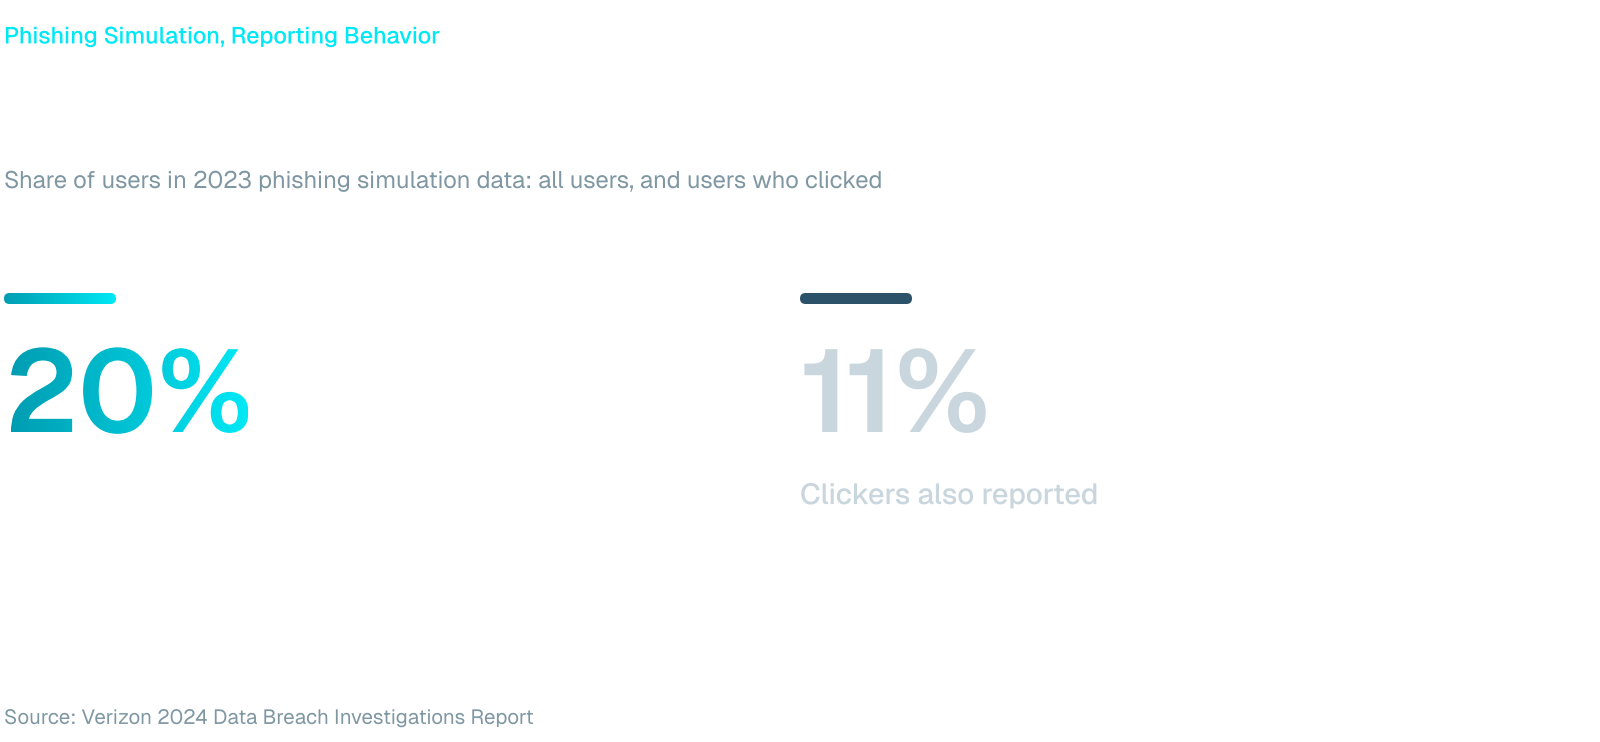
Those figures come from a wide pool, so use them as a reminder that reporting varies between people and can be measured. In your own program, watch how your reporting rate moves from month to month. A click followed by a report is a better outcome than a click in silence, because the security team hears about the lure while it is still live.
Reading Human Risk Metrics by Role
A company-wide average hides the people who matter most. A reporting rate can look healthy overall while accounts payable and executive assistants sit well below it, and those are the roles that handle bank-detail changes and calendars full of other people's requests.
Human risk metrics become useful once they are cut by role, department and exposure. Odin scores each employee continuously and weights role criticality, so the review can start with the roles where a mistake costs the most. Our guides to human risk assessment by role and department and the human risk score describe what goes into those numbers.
Then look at direction per person, not at the campaign average. Graybait tracks individual susceptibility over time, weakness coverage and difficulty progression, so a program that runs without campaigns still produces the per-person trend the review needs.
Connect Each Metric to an Action
A metric earns its place in the review only if a result changes something. Slow time to report in one department points to a reporting habit problem, which a one-tap report button and a short nudge can address. Repeat behavior in one role points to training that does not match the work, which role-based micro-learning addresses.
Time to response is the easiest metric to leave out. When the gap between a risky behavior and the training that follows is days long, the lesson arrives after the moment has passed. Zero-Touch Training responds at once with training matched to the behavior, inside Microsoft Teams, which removes the delay between exposure and response, and the metric shows it.
Run the Review in Five Steps
- Pull the five measures for the last 30 days, by role and department.
- Flag the groups that moved furthest from their own previous month.
- Name one action and one owner for each flagged group.
- Check last month's actions against this month's numbers.
- Choose which results move up into the board view.
Compare each group with its own history before comparing it with anyone else. Roles, sectors and languages differ, and your first few months of data are the most honest baseline you have. In a GCC workforce that receives simulations in Arabic and English, read each language group against its own history as well.
Your Next Monthly Review
Back at the monthly review, the click rate and the completion rate are still on the screen, and now they have company. Add reporting rate and time to report for the next one, cut by role, and attach one action to each result. Once those two run steadily, the board view is a selection from data you already trust.
Frequently Asked Questions
What are the most useful security awareness metrics?
Reporting rate, time to report, repeat behavior, coverage and time to response give the most to act on. Together they show whether people notice attacks, how fast they speak up, whether habits change and whether every role is being exercised. Click rate and completion remain useful as context alongside them.
How often should I review security awareness metrics?
Monthly suits the operational view, because 30 days is enough for simulations and training to produce a change you can see by role. Weekly checks suit specific alerts, such as a department with a sudden drop in reporting. The board view can then draw on the monthly results at whatever interval the board meets.
How do human risk metrics differ from security awareness KPIs?
Security awareness KPIs summarize program performance, such as reporting rate across the organization. Human risk metrics describe individuals and groups, such as a person's risk score, a role's repeat behavior or how fast a team responds. The second set feeds the first, and it is where the monthly actions come from.
Is click rate still worth tracking?
Yes. Click rate shows how convincing a lure was for a given group. Read it next to reporting rate and time to report, because a group that clicks but reports quickly is in a different position from one that clicks and stays silent.