




A director who has read the 2026 Verizon Data Breach Investigations Report knows the human element was present in 62% of breaches. The director's next question is what the company's own number is and whether it is falling. This post is for GCC security leaders who need security awareness KPIs for the board that answer that on a single page.
In short: Lead with four measures instead of the completion rate: exposure trend, reporting rate, time to report and the repeat-risk cohort. Show each as a trend by role group, keep names out of the pack, and keep completion as one line of compliance evidence.
Why Completion Rates Stop Answering the Question
Completion is the easiest number an awareness program can produce. It shows the program ran, which auditors and regulators will ask about, and it says little about whether people handle the next suspicious message better than the last. A director reading it has no way to tell.
Directors tend to ask three things, in some order: is human risk going down, where does it sit in the organization, and how quickly do we react when someone is targeted. Four measures answer those, and each has to make sense to a director reading the page without you in the room.
Four Security Awareness KPIs for the Board
These four fit on one page, and each can be defined in a sentence.
- Exposure trend is the median per-employee risk score and the share of employees in the highest risk band, by month.
- Reporting rate is the share of suspicious messages that employees report, shown next to the click rate and split by channel.
- Time to report is the median number of minutes from delivery to the first report.
- The repeat-risk cohort is the count of employees who show risky behavior in consecutive periods after follow-up, by function.
Completion stays on the page as a single compliance line beneath them. The first and last of the four need a score for each person rather than each campaign, so they come first.
Exposure Trend and the Repeat-Risk Cohort
An organization-wide average hides the places a director cares about. A score that holds steady overall can still be climbing in accounts payable, where one successful message can move money. Exposure therefore starts at the individual, weighted by role, and rolls up to the page afterward.
Fraus Odin scores every employee continuously from behavioral signals and weights each score by role criticality. Grouped by function, those per-person scores give the page its trend line and its share of employees in the highest risk band.
The repeat-risk cohort reads the same data from the other side, as the group that keeps showing risky behavior after follow-up. Report its size, the functions it sits in and what happened next. When an individual's risk reaches critical levels, Odin notifies the relevant stakeholders automatically and can recommend or assign training, policies and controls, so the page shows actions taken as well as a count.
Reporting Rate and Time to Report
The other two measures start when a suspicious message lands. Click rate alone gives half of that picture. NIST's work on its Phish Scale notes that click rates analyzed on their own can create a false sense of security, because a low rate may come from emails that were too easy, lacked relevant context or resembled an earlier exercise.
So record each simulation's difficulty next to its click rate, and put the reporting rate beside both. That record matters more once each simulation is matched to the person's role, behavior and difficulty level, as our post on automated phishing simulation describes.
Channel matters as much as difficulty. In the 2026 Verizon DBIR, the median click rate in simulated phishing campaigns using voice and text lures was 40% higher than for email. A pack that reports email results alone leaves out the channels where simulations succeed more often, so split click and reporting rates by channel.
Reporting earns its own line because it does not simply mirror clicking. As SC Media reported from Verizon's 2024 DBIR, 20% of users reported phishing in simulation engagements, and 11% of the users who clicked the email reported it as well. The overall reporting rate had been growing for several years, so treat 20% as a reference point and make your own trend the headline.

Speed is the other half of reporting. The same DBIR put the median time for users to fall for phishing emails at under 60 seconds. Measure how long the first report takes to arrive, because that figure tells the security team how much of a head start it gets.
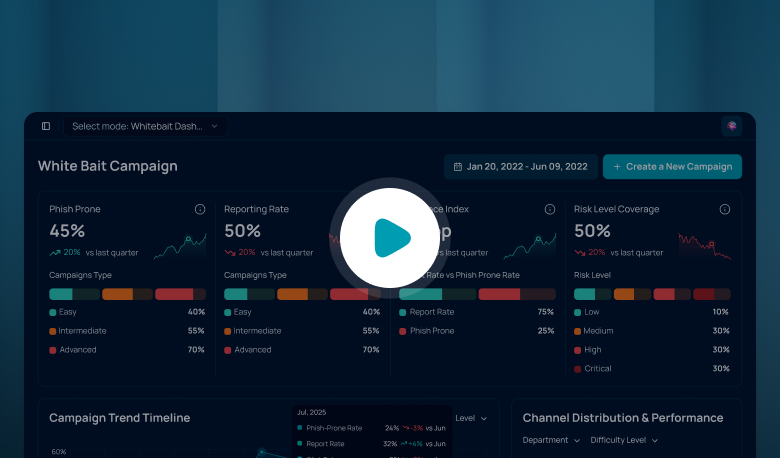
Friction affects both numbers. The 2026 report advises making it as painless as possible for people to notify you when they have fallen for something. Fraus Whitebait tracks reporting rate next to click rate, and the Fraus Teams App lets employees report a suspicious message from inside Microsoft Teams with a single tap.
Building the One-Page View for GCC Boards
Four numbers help only if directors can read them. Give each KPI the same four things: this quarter's value, the last four quarters as a trend, a target and one sentence on what you did about it. Use the same layout at every meeting, and cut by role group instead of by campaign.
Keep names out of the pack. Directors need cohorts and functions, and individual scores stay with the program team. Where policy keeps employee-level data in the country, the hosting model matters too, and Fraus can be hosted on UAE or GCC servers or deployed fully on-premise.
Language is one more cut that belongs on the page. Where employees work in both Arabic and English, split the reporting rate by language group. A gap between the two is a content problem to fix before it is a people problem.
The same page serves the regulator conversation. Saudi Arabia's Essential Cybersecurity Controls (ECC-2:2024) apply to government entities and to private-sector owners, operators and hosts of critical national infrastructure. They ask for an awareness program delivered through multiple channels (1-10-1), implemented (1-10-2) and periodically reviewed (1-10-5). Control 1-2-3 calls for a cybersecurity supervisory committee formed on the instruction of the entity's Authorized Official, a natural audience for this page.
In the UAE, the UAE IA Regulation, issued by the Telecommunications and Digital Government Regulatory Authority, sets management and technical information security controls for the entities it covers. Ask your compliance lead which controls your four KPIs and your completion line support, and label the page that way.
Take One Page to the Next Board Meeting
The director who asked for the human number does not need a longer report. Pick the four definitions this week, pull last quarter's data against them and draft the page with a target and one action beside each number.
If a number cannot be produced from your current tools, record that as the first gap to close and say so in the pack. Directors can act on a named gap, but not on an estimate presented as a measurement.
Frequently Asked Questions
What cybersecurity metrics should I report to my board?
Report outcomes on one page and keep activity counts as supporting evidence. For awareness, that means exposure trend, reporting rate next to click rate, time to report and the repeat-risk cohort, each shown as a trend by role group, with completion as a single compliance line. Other domains, such as vulnerabilities or suppliers, take their own lines in the same layout.
How do you present cybersecurity risks to the board?
Use plain language and the same layout every time: current value, trend, target and the action you took. Start from the business consequence, such as a fraudulent payment or downtime, and describe what a control does instead of naming the product. State risks as they are, without playing them down or overstating what your controls achieve.
How can I communicate cybersecurity ROI to the board?
Show movement against targets you set at the start, and tie each target to something the board already tracks. Falling exposure in finance roles and faster first reports are both measurable. Avoid savings figures you cannot trace to your own data, because directors will ask where the number came from.